Scullers Head 2000

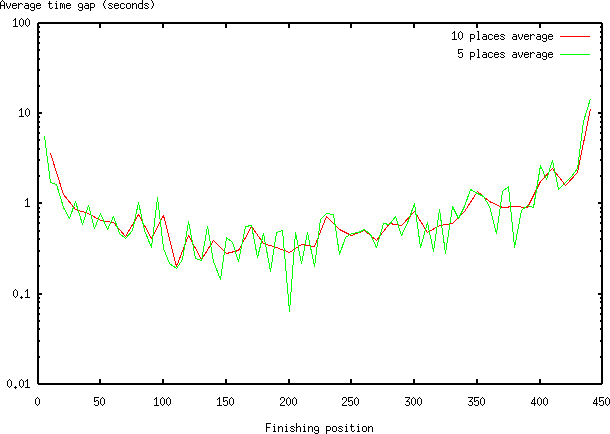
This is a graph of the interarrival time of scullers for the scullers head 2000, 1st April 2000. We average the gap between finishing times to get the graph; the green line is averaged over 5 finishing positions and the red is over 10 finishing positions.
You can see that finishers are most closely packed around the 100-200 mark, and for the majority of finish positions (25-400) less than a second separates each place.